If you want a reliable Core Web Vitals check, you need to know two things:
- Which data you’re looking at (real users vs simulated test).
- Which tool answers which question (site-wide vs single URL debugging).
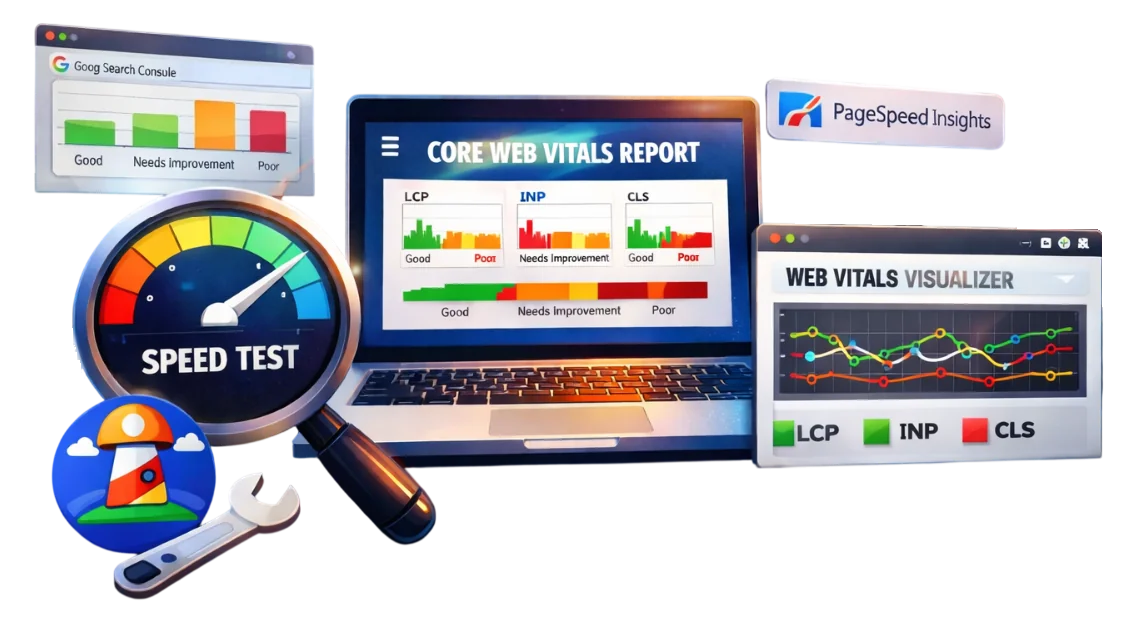
This guide walks you through a practical workflow used in real audits: start with Google Search Console (field data), validate and diagnose with PageSpeed Insights + Lighthouse, then monitor with lightweight tools like the Web Vitals extension.
Table of contents
- What are Web Vitals and Core Web Vitals?
- Core Web Vitals metrics and thresholds (LCP, CLS, INP)
- Field data vs lab data (why your tools disagree)
- Step-by-step: how to check Core Web Vitals (recommended workflow)
- Check Core Web Vitals in Google Search Console (site-wide)
- Check Core Web Vitals with PageSpeed Insights (single URL)
- Check Core Web Vitals with Lighthouse (lab debugging)
- Check Core Web Vitals in Chrome DevTools Performance tab (trace + live metrics)
- Monitor with the Web Vitals Visualizer Chrome extension (quick checks)
- What “Core Web Vitals assessment failed” means
- Core Web Vitals update and Page Experience update: what changed
- FAQ
1) What are Web Vitals and Core Web Vitals?
Web Vitals are a set of user experience metrics. Core Web Vitals are the subset Google focuses on for measuring real-world page experience across:
- Loading performance – LCP
- Visual stability – CLS
- Interactivity – INP
Google recommends achieving “good” Core Web Vitals for better user experience and as part of how its ranking systems evaluate page experience signals.
2) Core Web Vitals metrics and thresholds (LCP, CLS, INP)
Today’s Core Web Vitals metrics are:
Largest Contentful Paint (LCP) – loading
Measures how quickly the main content appears.
- Good: ≤ 2.5s
- Needs improvement: 2.5s-4.0s
- Poor: > 4.0s
Cumulative Layout Shift (CLS) – visual stability
Measures unexpected layout movement.
- Good: ≤ 0.1
- Needs improvement: 0.1-0.25
- Poor: > 0.25
Interaction to Next Paint (INP) – interactivity
Measures responsiveness to user interactions.
- Good: ≤ 200ms
- Needs improvement: 200-500ms
- Poor: > 500ms
Important: INP officially replaced First Input Delay (FID) in March 2024. You’ll still see “FID” in some older articles and tool UI, but INP is the current metric.
3) Field data vs lab data (why tools disagree)
A lot of confusion around “core web vitals score” comes from mixing two data types:
Field data (real users)
- Aggregated from real Chrome users over a period of time
- Reflects actual devices, networks, locations, and user behavior
- Used in Search Console CWV report (via CrUX)
Lab data (simulated test)
- Controlled, repeatable test in a specific environment
- Best for debugging and reproducing problems
- Typical of Lighthouse runs
Your numbers can differ because the underlying dataset differs. A lab run might look great while real users still struggle (or the opposite).
4) Step-by-step: how to check Core Web Vitals (recommended workflow)
Use this workflow to avoid chasing noise:
- Start in Google Search Console (site-wide field data, grouped by templates)
- Pick 1-3 representative URLs per template
- Run PageSpeed Insights on each URL (field + lab, plus diagnostics)
- Use Lighthouse to reproduce issues and validate improvements (lab debugging)
- Use Web Vitals Visualizer extension as a quick QA sanity check (desktop)
- Re-check after changes, but remember field data updates slowly
This approach aligns with how Search Console groups pages and how Google positions CWV tooling and data sources.
5) How to check Core Web Vitals in Google Search Console
Best for: a site-wide Core Web Vitals report, finding affected templates, prioritization.
Data type: Field data (CrUX-derived).
Tool card
- Licence: Free
- Website: Google Search Console
- Account: Required (site ownership)
- Check type: Site-wide
Steps
STEP 1 Open Search Console and select your property.
STEP 2 Go to Experience -> Core Web Vitals.
Note: Google removed the dedicated Page Experience report in late 2024 to simplify Search Console. You’ll still find CWV insights in the Core Web Vitals report (and HTTPS elsewhere).
STEP 3 Switch between Mobile and Desktop.
STEP 4 Identify whether issues are “Poor” or “Need improvement”, and open the details.
STEP 5 Click an issue to see affected URL groups (template-level grouping).
STEP 6 Export the issue URLs (if available) or copy examples for testing.
How to interpret GSC grouping (quick rule)
- If a group contains many similar URLs (e.g., product pages), treat it as a template problem.
- Fix one representative URL, then re-check the group’s field status over time.
6) How to check Core Web Vitals using PageSpeed Insights
Best for: checking one URL quickly, understanding field vs lab on the same page, getting prioritized diagnostics.
Data type: Mix of field + lab (depending on availability).
Tool card
- Licence: Free
- Website: PageSpeed Insights
- Account: Not required
- Check type: Single URL
Steps
STEP 1 Open PageSpeed Insights and paste your URL. Click Analyze.
STEP 2 Review the “Core Web Vitals Assessment” status (Pass/Fail).
STEP 3 Check field data first (if available). Field data reflects real users and aligns with Search Console’s CWV approach.
STEP 4 Switch between Mobile and Desktop results.
STEP 5 Scroll to diagnostics/opportunities and open the drop-downs to see which resources are driving the metric.
How to use PSI for an article-style workflow
- Use PSI to validate one URL from each problematic Search Console group
- Save a “before” report screenshot, implement improvements, then save an “after” screenshot
7) How to check Core Web Vitals using Lighthouse
Best for: reproducing issues reliably, debugging performance regressions, validating changes before shipping.
Data type: Lab data.
You can run Lighthouse:
- in Chrome DevTools (recommended), or
- via a Chrome extension (optional)
Tool card
- Licence: Free
- Website: Lighthouse (Chrome)
- Account: Not required
- Check type: Lab debugging
Lighthouse in Chrome DevTools (recommended)
STEP 1 Open the page you want to test in Chrome.
STEP 2 Open DevTools (Ctrl+Shift+I / Cmd+Option+I).
STEP 3 Go to the Lighthouse tab.
STEP 4 Choose:
- Mode (Navigation is typical)
- Device (Mobile vs Desktop)
- Categories (Performance at minimum)
Then run the audit.
STEP 5 Review key metrics (LCP, CLS) and supporting lab metrics.
Note: Lighthouse is lab-based; some interactivity signals may be represented through related lab metrics rather than exactly matching field INP.
Practical advice
- Run at least 3 audits and use the median result.
- Test with extensions disabled (or in a clean profile) to reduce variance.
8) How to check Core Web Vitals in Chrome DevTools Performance tab (live metrics + traces)
Best for: finding why you have CLS/INP/LCP problems by looking at a performance trace and real-time “live” vitals while you interact with the page.
Data type: Mostly lab/runtime (local), with optional field metrics from CrUX if available.
Unlike Lighthouse (which gives a summarized audit), the Performance panel is where you debug the underlying cause: long tasks, layout shifts, heavy JS, rendering spikes, etc.
Tool card
- Licence: Free
- Website: Chrome DevTools (Performance)
- Account: Not required
- Check type: Debugging / profiling (single page)
Quick check: Live Core Web Vitals in the Performance tab
When you open the Performance panel, DevTools shows a Live metrics screen with the three Core Web Vitals (LCP, CLS, INP) and updates them as you interact with the page.
STEP 1 Open the page you want to test in Chrome.
STEP 2 Open DevTools -> Performance tab.
STEP 3 On the Live metrics screen, watch LCP / CLS / INP update while you:
- scroll
- open menus
- click buttons / filters
- submit forms
This is especially useful for CLS/INP issues that only happen after interaction.
Optional (recommended): enable Field metrics (CrUX) inside the Performance panel to compare local values vs real-user values (where available).
9) Monitoring Core Web Vitals with the Core Web Vitals Visualizer extension
Best for: quick, real-time checks while QA-ing pages on desktop.
Limitations: great for quick feedback; not a substitute for Search Console field data.
Tool card
- Licence: Free
- Website: Core Web Vitals Visualizer Chrome extension
- Account: Not required
- Check type: Quick checks
Steps
STEP 1 Install the Web Vitals extension from the Chrome Web Store.
STEP 2 Open your page and click the extension icon (puzzle icon -> Core Web Vitals Visualizer).
STEP 3 Interact with the page (scroll, click, open menus) and watch metrics update.
This is a useful “developer ergonomics” tool: you can catch obvious layout shifts (CLS) or responsiveness problems early, before real-user data accumulates.
10) What “Core Web Vitals assessment failed” means (and what to do)
You may see “core web vitals assessment failed” in PageSpeed Insights or similar reporting contexts. In practice, it usually happens when:
- There is no sufficient field data available for that URL/origin, or
- The tool can’t compute/aggregate the assessment reliably
What to do
- Check the same URL in Search Console CWV report (if the property is verified).
- Try a different representative URL from the same template.
- Use lab tools (Lighthouse) to diagnose issues anyway; you can still improve real experience even before field data appears.
11) Core Web Vitals update and Page Experience update: what changed
If you’re tracking “core web vitals update” history, here are the key milestones to mention in a modern CWV audit:
- Mid-June 2021: Google began rolling out the Page Experience update (mobile), incorporating CWV as part of page experience signals.
- February–March 2022: Page experience signals expanded to desktop ranking systems (rollout completed March 2022).
- March 12, 2024: INP replaced FID as the interactivity Core Web Vital.
- Nov 2024: Google removed the Search Console Page Experience report (CWV and HTTPS reports remain).
12) FAQ
Is Core Web Vitals a ranking factor?
CWV is part of Google’s broader page experience signals and Google recommends improving it; it’s not a guarantee of rankings by itself. Content relevance and many other factors still matter.
Why does Search Console show different numbers than PageSpeed Insights?
Search Console CWV is based on CrUX field data and groups pages; PSI can show field data (if available) plus lab diagnostics. Different datasets and aggregation can lead to different results.
Should I run a Core Web Vitals audit regularly?
Yes – especially after major releases, theme/plugin changes, or performance incidents. Many teams run a lightweight monthly check and deeper audits quarterly.
Do I need a Core Web Vitals consultant?
If you have persistent “Poor” groups in Search Console and limited dev capacity, a consultant can help prioritize fixes and measure impact.